Cryptocurrency is such a revolutionary departure from the status quo that it’s easy to forget that it’s been possible to buy Bitcoin for an entire decade now. While that’s an eye-blink compared to traditional assets like gold or even stocks, it’s certainly long enough to establish a solid historical price record. And as they say about history, it doesn’t repeat but it does rhyme…
A decade of Bitcoin
We don’t have a crystal ball that can tell us whether you should buy Bitcoin or sell it, nor what the Bitcoin price will look like down the road. However, by identifying and analyzing these rhyming or cyclical price patterns, we can make some educated guesses about what the future holds for crypto valuations and the Bitcoin market.
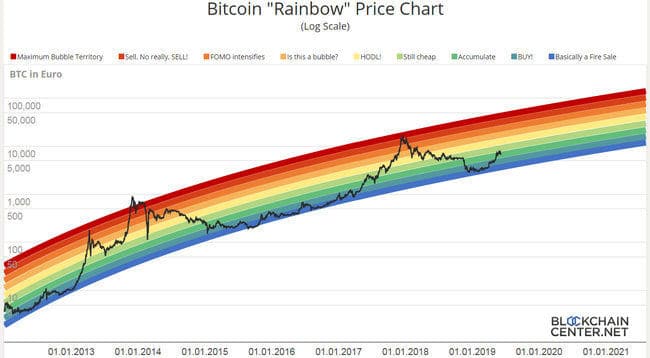
The above Rainbow Chart is pretty well-known to Bitcoin buyers and enthusiasts. It’s a long-term logarithmic scale chart of Bitcoin’s price in Euros since January 2012. Log scale is necessary if we wish to compare Bitcoin’s early price patterns to later ones, as early price action is all but invisible on a linear (or standard) price chart, given how much the Bitcoin price has risen over the years. A log scale makes early and later moves comparable. For example, despite occurring over vastly different time spans, Bitcoin’s 2012 move from €10 to €100, is roughly equivalent in magnitude and importance as its move from €100 in late 2013 to €1000 in early 2017. While the €90 price jump in 2012 would barely appear on a linear scale, given that Bitcoin reached highs of €16000 in 2017 and experiences daily jumps of €1000, on a log scale we see that that price increase was actually fairly significant.
Now that we can easily compare movements over time, some clear patterns emerge:
-
Firstly, it’s immediately apparent that despite some occasional dips, on average, the Bitcoin price rises over time. This suggests people who have thus far employed the strategy to buy Bitcoin and hodl have historically made a sound choice.
-
Secondly, the rainbow chart gives us a rough guide for determining when Bitcoin is under, over, or fairly valued. When price languishes along the lower, blue edge of the rainbow, Bitcoin is undervalued, the BTC price is low, and it’s a good time to buy Bitcoin. On the other hand, when the price hits or breaks the upper, red band, historically speaking, Bitcoin is overvalued, will shortly correct itself, and it’s probably time to cash in! Of course, hindsight is 20-20, and determining when that’s going to happen in the future is a lot harder.
-
Thirdly, the colored zones offer clues as to the general sentiment prevalent in the Bitcoin or general crypto community at certain price levels. Generally speaking, the mood is depressed during times of cool colors but increasingly excited as the colors heat up. More on this topic later, in the section below on sentiment cycles.
While the rainbow chart can be critiqued for being overfit (that is, error-prone due to too closely fitting a limited set of data points), the way that the recent price fall from the 2017 high has respected the lower bound does lend the model more credence.
Sentiment Cycles
Consider the following chart from Wall St. Cheat Sheet, which does an excellent job of explaining how market sentiment often correlates to price action:
How does this apply to the Bitcoin market? Compare this chart to Bitcoin’s price action from the last two boom and bust cycles (or in crypto terms, moon and doom or Lambo and rekt cycles):
This is similar, in turn, to the previous cycle:
While the timeframes don’t line up perfectly, the overall shape is eerily similar. But that’s not all; if you consider Google search volume as an accurate indicator of public interest in crypto and take a look at the Bitcoin-related Google search volume from around the time of the above two price cycles, you’ll see a distinct similarity between the two.
Here’s what Google search volume looked like during the last cycle between mid-2017 and now:
And here’s what it looked like during the previous cycle, from August of 2013 and into November of 2015:
From this, we can conclude that price, sentiment, and public interest are all so closely linked as to be inextricable. Indeed a positive feedback loop is at work, which serves to amplify all three factors.
The feedback loop of all three factors together works more or less as follows:
-
Although Bitcoin crashed sometime in the last year or two, its price has since found a floor and looks stable. As a result, Long-term investors, seeing potential for another future rise, start to buy Bitcoin.
-
Once the supply of Bitcoin around the “floor” price dries up, it causes the price to start creeping upwards, and this upwards movement inevitably attracts a new batch of shorter-term investors and traders.
-
Volumes start rising and the price starts to become noticeably higher. This results in stories about Bitcoin’s death, popular during the crash, to start to be replaced by news of its increasing value in the financial press and across social media.
-
The buzz starts, and these stories spread awareness of Bitcoin’s profit potential among the general public. The general public starts to search the internet for more information, and the increased search demand for Bitcoin leads to the creation of more Bitcoin content.
-
Everybody wants to buy Bitcoin and is telling everybody else how about how much money they made. Prices are astronomical as Bitcoin mania peaks!
-
There are no new buyers left, so the price can only collapse. Cue a crash.
-
Some of the new entrants, convinced of the fundamental value of the technology, decide to hold onto their bitcoins. The price slowly finds a floor.
-
Repeat from the top!
When you look at the above cycle on daily or weekly charts, you’ll see a lot of volatility. In fact, much of the criticism or skepticism surrounding Bitcoin is based on its unpredictability and price volatility. But look at a yearly chart of the lowest prices, and you’ll see quite a different picture: with the exception of 2015, since 2012, the minimum price of Bitcoin each year has always been higher than the minimum price the year before.
Conclusion
We’ve seen these cycles play out at least 5 or 6 times over Bitcoin’s 10-year history, and there’s no reason to expect them to end any time soon. But while each crash comes with understandable panic and anxiety for Bitcoin investors, the overall trend of Bitcoin has been largely positive, swinging upward. Like we said at the start, we, unfortunately, don’t have a crystal ball with which we can predict Bitcoin’s price or its patterns. It’s impossible to know whether the rainbow will continue in an upward direction, or if it will become a frown. Nor can we tell if patters will continue as they’ve been established. But by understanding both Bitcoin’s historical cycles and the overall market sentiment chart, you can better time your entry into and exit from the Bitcoin market, and make your own personal best-educated guess as to whether to buy, sell, or hodl.
Enlightening Inquiries: Deciphering Bitcoin’s Market Cycles
1. What is the “rainbow chart” and how is it used in Bitcoin analysis?
The rainbow chart is a logarithmic scale chart used to analyze Bitcoin’s price over time, helping to identify when Bitcoin is undervalued or overvalued. It segments price levels into color-coded bands, indicating potential buying or selling opportunities based on historical patterns.
2. How does market sentiment influence Bitcoin’s price?
Market sentiment plays a crucial role in Bitcoin’s price movements. Positive feedback loops, driven by price changes, media coverage, and public interest, create cycles of rising and falling prices. These cycles are reflected in sentiment shifts, correlating closely with price actions and public interest levels.
3. Can we predict Bitcoin’s future price movements with certainty?
While historical data and patterns like the rainbow chart provide insights, predicting Bitcoin’s future prices with absolute certainty is impossible. The market’s inherent volatility and unpredictability mean that educated guesses are the best anyone can offer, emphasizing the importance of research and risk management in investment decisions.