
Block reward drops 3.125 1.5625 BTC
The Bitcoin block reward drops from 3.125 BTC to 1.5625 BTC at the next halving, estimated for 13 April 2028, 12:14 UTC.
Buy Bitcoin before the halving
Bitcoin has no calendar: the halving happens at block 1,050,000, not on a date. The countdown assumes Bitcoin's 10-minute average block time, so the real moment shifts slightly as blocks are found faster or slower than target.
Roughly every four years, the amount of new Bitcoin created with each block is cut in half. It is the single most predictable event in an otherwise unpredictable market — written into Bitcoin’s code by Satoshi Nakamoto and never once missed.
The fifth halving arrives at block 1,050,000, when the reward for mining a block drops from 3.125 BTC to 1.5625 BTC.
Below: what a halving actually is, every halving that has happened so far, what the price really did after each one — including the awkward part most halving articles leave out — and what it means for you.
What Is a Bitcoin Halving?
Every time a miner adds a block to the Bitcoin blockchain, they are paid a reward in newly created Bitcoin. That reward is the only way new BTC ever enters circulation.
But Bitcoin has a hard cap: 21 million coins, ever. To stretch that supply across more than a century instead of burning through it in a decade, Satoshi wrote a rule into the protocol: every 210,000 blocks — about four years at Bitcoin’s ten-minute average block time — the reward is cut in half.
The short version
A halving does not change how much Bitcoin exists. It changes how fast new Bitcoin arrives — and it cuts that rate in half, overnight, on schedule.
Why should that move the price? Because supply and demand still apply. When a central bank prints more of a currency, each unit is worth less — that is inflation, and everyone has felt it. Bitcoin does the opposite on a fixed timetable: the flow of new coins keeps shrinking while the total that can ever exist stays frozen at 21 million.
That is the theory, anyway. The history is more interesting than the theory, so let’s look at it.
Every Bitcoin Halving So Far
Four halvings have happened. The fifth is the one counting down at the top of this page.
| Halving | Date (UTC) | Block | Reward | BTC price that day |
|---|---|---|---|---|
| — | 3 Jan 2009 | 0 | 50 BTC | No market yet |
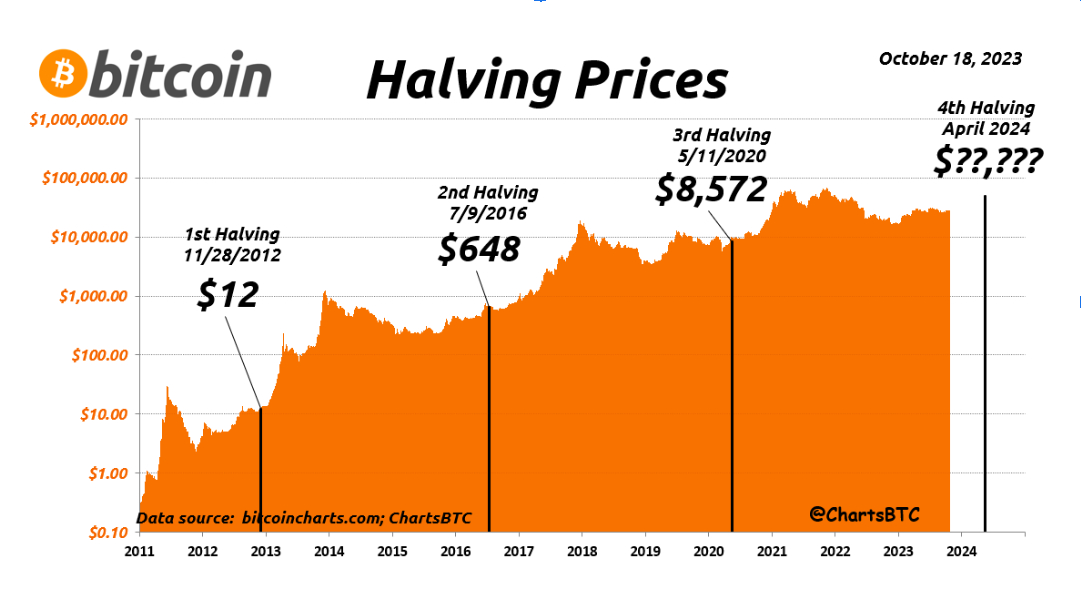
| 1st | 28 Nov 2012 | 210,000 | 50 → 25 BTC | ~$12 |
| 2nd | 9 Jul 2016 | 420,000 | 25 → 12.5 BTC | ~$648 |
| 3rd | 11 May 2020 | 630,000 | 12.5 → 6.25 BTC | ~$8,572 |
| 4th | 20 Apr 2024 | 840,000 | 6.25 → 3.125 BTC | ~$63,800 |
| 5th | ~13 Apr 2028 | 1,050,000 | 3.125 → 1.5625 BTC | — |
Around 95% of all Bitcoin that will ever exist has already been mined. The remaining ~5% will trickle out over the next hundred-odd years, halving after halving, until the last fraction of a coin is issued somewhere around 2140.
The Halvings on a Price Chart
The clearest way to see the effect is to put the halvings on a logarithmic price chart and look at each era in turn:
1) The Pre-Halving Era — 50 BTC per block
January 2009 – November 2012 • Blocks 0–210,000
Bitcoin’s first four years, when almost nobody was watching. Satoshi set the opening reward at 50 BTC per block, and the result was rapid early issuance: half of Bitcoin’s entire 21 million supply was created in this single era.
For much of 2009 there was no price at all, because there was no market. Only in late 2010, as the first exchanges appeared, did BTC clear $1. That proof of value pulled in more miners, mining difficulty climbed, and a real competition for faster hardware and cheaper electricity began.
The pattern that would repeat for the next decade showed up here for the first time: price began climbing into the halving, as the market started pricing in a supply cut that everyone could see coming.
2) First Halving Era — 25 BTC per block
November 2012 – July 2016 • Blocks 210,000–420,000
With 50% of supply issued in era one, another 25% arrived in era two — putting 75% of all Bitcoin into circulation by 2016. Supply growth halved; awareness did the opposite.
Price went from around $12 to a peak above $1,100 in late 2013, roughly a year after the halving. Then Mt. Gox — the dominant exchange of the era — collapsed, and Bitcoin spent two years grinding sideways and down. Crucially, it never fell back below the previous era’s peak. That floor-above-the-last-peak behaviour became the signature of every cycle since.
3) Second Halving Era — 12.5 BTC per block
July 2016 – May 2020 • Blocks 420,000–630,000
The era of competition. Ethereum arrived as a serious alternative, and the ICO boom inflated the whole crypto market into a bubble that peaked around $19,700 in December 2017 — about 17 months after the halving.
The hangover was brutal, with an ~84% drawdown through 2018. But once again, the bottom of this era sat far above the top of the last one.
4) Third Halving Era — 6.25 BTC per block
May 2020 – April 2024 • Blocks 630,000–840,000
The halving that landed in the middle of a pandemic. As governments printed money at record speed, Bitcoin’s fixed, shrinking issuance made a very loud argument for itself, and the “digital gold” framing went mainstream.
Bitcoin crossed a $1 trillion market cap for the first time and peaked near $69,000 in November 2021 — about 18 months after the halving. Then came the 2022 unwind: Terra, Celsius, and FTX collapsed in sequence and BTC fell under $16,000. And then it recovered, again, without ever revisiting the previous era’s peak.
5) Fourth Halving Era — 3.125 BTC per block
April 2024 – ~April 2028 • Blocks 840,000–1,050,000 — this is where we are now
Block 840,000 was mined by ViaBTC at 00:09 UTC on 20 April 2024, with BTC trading near $63,800. It was also the most valuable block in Bitcoin’s history: on top of the 3.125 BTC subsidy, that block collected 37.63 BTC in transaction fees — more than twelve times the block reward itself — as traders raced to mint tokens on the newly launched Runes protocol.
The most valuable block ever mined
Block 840,000 paid its miner 40.75 BTC in total — 3.125 BTC of new supply plus 37.63 BTC in fees. It was a preview of Bitcoin’s long-term future, where fees, not new coins, pay for network security.
What Actually Happened After the 2024 Halving
This is the part worth being honest about, because the 2024–2026 cycle delivered both halves of the halving story.
Bitcoin rallied hard after the halving. It broke $100,000 for the first time in December 2024, and kept going through 2025 to an all-time high of $126,080 on 6 October 2025 — roughly 18 months after the halving, almost exactly the lag seen in 2013, 2017 and 2021.
And then it fell. Hard. By mid-2026, Bitcoin was trading roughly half its October 2025 peak. That, too, is exactly what happened after every previous halving.
Read this part twice
Every halving cycle so far has produced a new all-time high and a drawdown of 50–85% from it. Anyone who tells you a halving is a guaranteed way to make money is only describing half the chart.
There is also a sample-size problem nobody can engineer away. Four halvings is four data points, spread across four completely different market environments — from a hobbyist forum in 2012 to spot ETFs and institutional balance sheets today. Four points is a story, not a statistical law.
What has held up across all four cycles is narrower, and more useful: each era’s low has been higher than the previous era’s high. The peaks are dramatic; the rising floor is the part that has actually been consistent.
The Stock-to-Flow Model (and Its Limits)
No halving article is complete without stock-to-flow, the model that made halvings famous outside crypto. It measures scarcity as a ratio: existing supply (stock) divided by annual new issuance (flow). Gold scores high because there is a lot above ground and very little added each year. Every Bitcoin halving cuts the flow in half, so Bitcoin’s ratio doubles overnight.
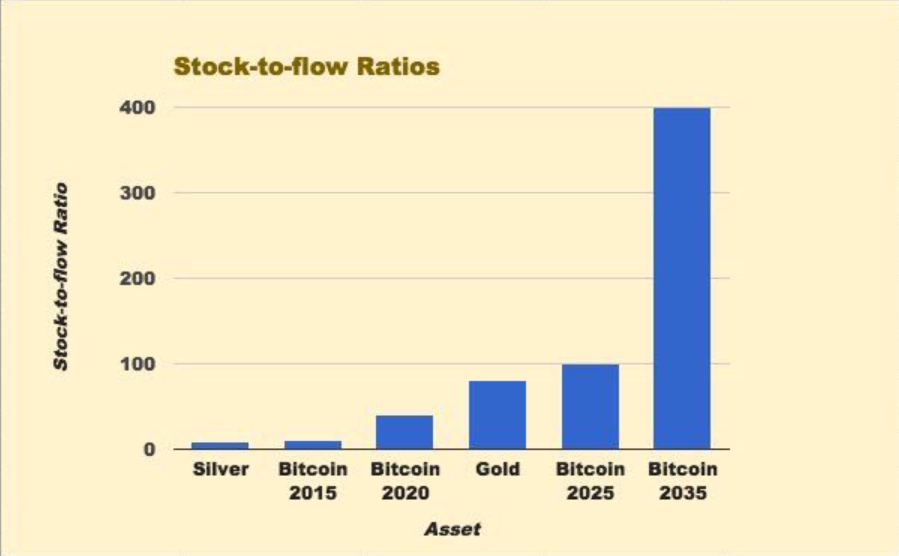
On that measure, Bitcoin has already passed gold. Its scarcity, by the numbers, is now the tightest of any major monetary asset — and it tightens again every four years.
The honest caveat: stock-to-flow describes scarcity well, but it has been a poor price predictor. The model’s original 2020 projections badly overshot what actually happened, and its author has publicly acknowledged as much. Treat it as a way to understand why halvings matter structurally — not as a price target.
What Changes at the 2028 Halving
At block 1,050,000, the block subsidy drops to 1.5625 BTC. Annual new issuance falls from roughly 164,000 BTC to around 82,000 BTC — less than half a percent of the total supply per year.
Three things are worth watching:
1. Miner economics. Mining revenue halves overnight while electricity bills do not. Historically, the least efficient miners shut down in the months after a halving, hash rate dips, and difficulty adjusts down to compensate. The network keeps running — that self-correction is built in — but the mining industry consolidates every single time.
2. The shift to fees. As the subsidy shrinks toward zero, transaction fees have to take over as the thing that pays for Bitcoin’s security. Block 840,000 — where fees out-earned the subsidy twelve to one — showed that is possible. Whether it is reliable is Bitcoin’s biggest open question, and each halving brings it closer.
3. A smaller supply shock each time. The first halving removed 25 BTC per block from new supply. The fifth removes 1.5625. In percentage terms the cut is identical — always 50% — but relative to the coins already circulating, each halving is a quieter event than the one before. That is by design, and it is worth remembering when someone extrapolates 2013’s returns onto 2028.
What Does This Mean for You?
The halving is the rarest thing in crypto: an event everybody can see coming, years in advance, with a date you can count down to. That makes it a good moment to think, and a bad moment to panic in either direction.
A few things worth holding onto:
- It is already priced in — and it isn’t. Everyone knows the date. What nobody knows is how demand behaves once the supply actually tightens, which is where the previous four cycles got interesting.
- Timing the top has beaten almost everybody. Each cycle’s peak arrived 12–18 months after the halving, not on the day — and each was followed by a drawdown of at least half.
- Steady beats clever. Buying a fixed amount on a schedule spreads your entry across the whole cycle instead of betting everything on one candle. It is the least exciting strategy and it has aged the best.
- Only risk what you can afford to lose. Bitcoin has halved in value more than once in every era covered on this page — including this one.
With Coinmama, you can buy, sell and swap crypto in minutes, with a low minimum and no complicated setup — whether you are building a position slowly or just want to own your first fraction of a bitcoin before the next halving arrives.
Bitcoin Halving FAQ
When is the next Bitcoin halving?
At block 1,050,000, currently estimated for around 13 April 2028. The exact date is unknowable because Bitcoin counts blocks, not days.
How often does the Bitcoin halving happen?
Every 210,000 blocks, which works out to roughly four years at Bitcoin’s ten-minute average block time. It has happened in 2012, 2016, 2020 and 2024.
Does the halving make the Bitcoin price go up?
Every halving so far has been followed by a new all-time high within about 12–18 months — and by a drawdown of 50% or more from that high. Four cycles is a pattern, not a promise, and past performance does not predict future results.
What happens when all 21 million Bitcoin are mined?
Around the year 2140, the block subsidy reaches zero and no new Bitcoin is created. From then on, miners are paid entirely through transaction fees. Roughly 95% of all Bitcoin has already been mined; the final 5% is spread across the next century of halvings.
Do I need to do anything as a Bitcoin holder?
No. The halving is a change to miner rewards, not to your coins. Your balance, your keys and your wallet all work exactly as before — nothing is created, destroyed, or split.
Why is the halving date only an estimate?
Bitcoin targets one block every ten minutes, but real blocks land faster or slower depending on how much mining power is running. Difficulty readjusts roughly every two weeks to pull the average back to ten minutes, so the estimated halving date drifts by hours or days as the network speeds up and slows down.
What was the most valuable Bitcoin block ever mined?
Block 840,000 — the 2024 halving block itself. It paid its miner 40.75 BTC in total: 3.125 BTC of new supply plus a record 37.63 BTC in transaction fees.
Stay Informed with Coinmama
We will be tracking the road to block 1,050,000 the whole way. Subscribe to our newsletter for regular updates, insights and plain-English explainers on the crypto market.
Whatever the market is doing when the counter at the top of this page hits zero, block 1,050,000 will arrive on schedule — euphoria and panic have no vote. That is the whole point of it. As always, our friendly support team is here 24/7 if you have questions.
This article is for information only and is not financial advice. Cryptocurrency is volatile and you can lose money. Do your own research before investing.